02xl is your source for accurate and trustworthy information so you can make the best choices for your health and wellness.
PS: Please note that 02xl provides this information for the benefit of the rare disease and overweight community. 02xl is not a medical provider or health care facility and thus can neither diagnose any disease or disorder nor endorse or recommend any specific medical treatments. Patients must rely on the personal and individualized medical advice of their qualified health care professionals before seeking any information related to their particular diagnosis, cure or treatment of a condition or disorder.
Design
Patients with BHDS (n = 12) or PSP (n = 20) who experienced SP at Juntendo University Hospital, Tokyo Metropolitan Bokutoh Hospital, or Tamagawa Hospital, participated in this study and written informed consent was obtained from all participants. The mean ages were 38.7 (SD = 7.5) for BHDS patients and 25.0 (SD = 5.6) for PSP patients; 33.3% and 70.0% were male in patients with BHDS and PSP, respectively.
The diagnosis of BHDS was established by detection of germline FLCN mutations. The FLCN mutations of BHDS patients are summarized in Supplementary Table S1 online. The diagnosis of PSP in this study was defined as a patient with pneumothorax meeting the following 2 criteria: (1) age < 40 years and (2) no underlying lung diseases which had been assessed radiologically and pathologically. Electron microscopy was used to examine whether FLCN haploinsufficiency affects the morphology of PMCs. To characterize cellular functions of PMCs, we established the methods of isolating high-purity PMCs from patients. This study was approved by the Institutional Review Board of the Juntendo Hospital (No. 18-240) and conducted in accordance with the Declaration of Helsinki. Written informed consent was obtained from all participants.
Isolation and primary culture of PMCs from pleural lavage fluid
During surgery for SP, a lavage of the pleural space was performed with 100 ml of saline. The pleural lavage fluid was centrifuged at 1500 rpm for 5 min at room temperature. Supernatants were removed and red blood cells were lysed in the lysis buffer (Roche Diagnostics, Mannheim, Germany) for 5 min, followed by centrifugation and washing with phosphate-buffered saline (PBS) twice. The cells were cultured on a collagen-coated 10 cm dish (Corning Incorporated, Corning, NY, USA) with a complete medium, including medium 199 (Sigma-Aldrich, St. Louis, MO, USA) supplemented with 20% fetal bovine serum ([FBS]; Gibco, Grand Island, NY, USA), penicillin (100 U/ml), and streptomycin (100 μg/ml) at 37 °C in a humidified atmosphere of 5% CO2. The complete medium was replaced every 3 days.
Cultured cells were detached using 0.05% trypsin/0.2 mM ethylenediaminetetraaceteic acid ([EDTA]; Gibco) and resuspended in PBS with 1% FBS. Cells were incubated for 30 min with mouse anti-human mesothelin IgG antibody, biotinylated by EZ-Link NHS-Biotin (#20217; Thermo Fisher Scientific, Waltham, MA, USA), followed by incubation with Alexa Fluor 488-streptavidin conjugates (#S11223; Thermo Fisher Scientific) for 30 min, and Alexa Fluor 647-conjugated rat anti-human podoplanin antibody for 15 min. Mouse IgG1, κ and rat IgG2a, κ isotype control antibodies were used as isotype-matched control antibodies. Since both mesothelin and podoplanin were positive markers for PMCs, we sorted podoplanin and mesothelin double-positive cells by fluorescence-activated cell sorting (FACS), using a BD FACSAria III cell sorter (BD Biosciences, San Jose, CA, USA). The harvested cells were collected and centrifuged at 1500 rpm for 5 min. After cell density was adjusted, PMCs were cultured for each experiment in the complete medium. All assays were performed without passage because it was difficult to maintain the morphology and proliferation of BHDS-PMCs for more than 2 passages. The list of antibodies used for flow cytometric analysis is shown in Supplementary Table S2 online.
Electron microscopy
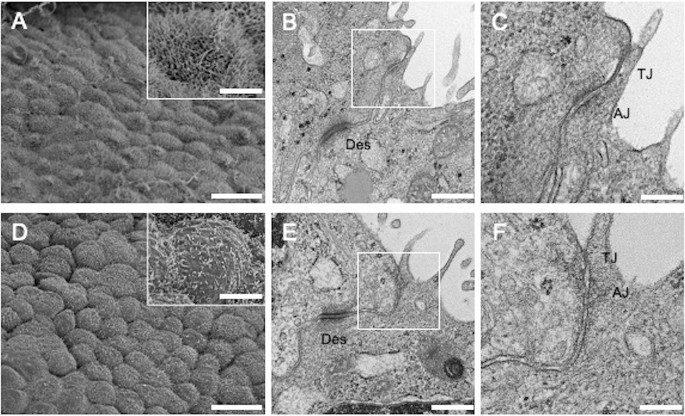
Using a scanning electron microscope (SEM), lung tissues resected during surgery for SP (and cultured PMCs) were fixed with 2% glutaraldehyde solution (TAAB Laboratories Equipment Ltd., Berks, England) in 0.1 M phosphate buffer (pH 7.4), followed by postfixation with 2% OsO4 in the same buffer. Fixed specimens were dehydrated with a graded series of ethanol. Dehydrated specimens were transferred into t-butyl alcohol and freeze-dried with an ES-2030 freeze dryer (Hitachi, Tokyo, Japan). After mounting on aluminum stubs with carbon paste, the dried specimens were coated with osmium using an OPC80T osmium plasma coater (Filgen, Inc., Aichi, Japan) and observed with an S-4800 field-emission SEM (Hitachi).
Using a transmission electron microscope (TEM), resected lung tissues were fixed with 2.5% glutaraldehyde, followed by the same postfixation procedure described above. Fixed specimens were dehydrated and embedded in Epok812 (Okenshoji Co., Ltd., Tokyo, Japan). Ultrathin sections were cut and stained with uranyl acetate and lead citrate. These sections were examined with an HT7700 TEM (Hitachi). Reproducibility was confirmed in 3 unrelated samples per group.
Polymerase chain reaction (PCR)
Isolation of total RNA, complementary DNA synthesis, and PCR were performed with a standard method. The lists of primers used for reverse transcription PCR (RT-PCR) and quantitative real-time reverse transcription PCR (qRT-PCR) analyses are shown in Supplementary Tables S3 and S4 online, respectively. Detailed procedures are described in Supplementary Information online.
Gene expression microarray analysis
Gene expression microarray analysis was performed in PSP-PMCs (n = 3) and BHDS-PMCs (n = 3) using a SurePrint G3 Human GE v3 8 × 60 K Microarray (Agilent Technologies, Inc., Santa Clara, CA, USA). The array contained 26,083 Enterz gene RNA probes (excluding non-coding RNA). The 6 samples were not well-clustered in each group using the total 26,083 genes and 1 PSP-PMCs sample was clustered into BHDS-PMCs group using 1799 genes when the level of differentially expressed gene was set at a fold change > 1.5 (Supplementary Fig. S1 online). We realized that only this PSP patient remained to be in pneumothorax under the chest tube drainage for about 2 weeks before surgery, i.e., the time when we collected pleural lavage fluid for the isolation of MCs. Therefore, we excluded this sample and used the results from 2 PSP-PMCs and 3 BHDS-PMCs samples. 3378 genes were identified as differential expression genes with a fold change > 1.5; 1637 and 1741 genes were up- and down-regulated, respectively, in BHDS-PMCs compared with PSP-PMCs. We evaluated Gene Ontology (GO) terms significantly affected (p < 0.01 and false discovery rate (FDR), Q < 0.001) among these genes. The assessment of GO terms and the generation of heatmaps were conducted using GeneSpring14.9.1 (Agilent Technologies, Santa Clara, CA, USA).
Gene set enrichment analysis
Gene set enrichment analysis ([GSEA], v4.0.3) was performed to assess GO enrichment regarding cell–cell adhesion or cell adhesion by comparing BHDS-PMCs with PSP-PMCs using the entire microarray data set in the GSEA Molecular Signatures Database. GSEA generated each ranked list and the degree of enrichment was indicated by a normalized enrichment score (NES). FDR was also calculated for each NES. FDR, Q < 0.025 and NES > 1 was considered significant.
Flow cytometric analysis of E-cadherin expression
Cultured PMCs were detached with 0.05% trypsin/0.2 mM EDTA and resuspended in PBS with 1% FBS. Cells were incubated for 15 min with allophycocyanin-conjugated mouse anti-human E-cadherin antibody or mouse IgG1, κ isotype control antibody. After incubation, samples were analyzed using a BD LSRFortessa cell analyzer (BD Biosciences), and further analyzed using FlowJo software (Ashland, OR, USA). The mean fluorescence intensity (MFI) ratio was calculated by dividing the MFI of the E-cadherin antibody sample by the MFI of the isotype control sample. An average MFI ratio of 3 samples with E-cadherin antibody was recorded as the representative value.
Detachment assay
PMCs were seeded onto a collagen-coated 12-well plate (Corning Incorporated) at a density of 1 × 10⁵ cells/well (in 3 replicate wells). Cells with 90% confluence were gently washed with calcium-free PBS twice and incubated with 1 mM ethyleneglycol-bis-(β-aminoethyl ether)-N,N,N′,N′-tetraacetic acid (EGTA), with a pH of 8.0, for 20 min. Supernatant was collected and the cell number was measured after centrifuge at 1500 rpm for 5 min (see details in Supplementary Information online).
Cell proliferation assay
A Cell Counting Kit-8 (Dojindo Molecular Laboratories, Inc., Tokyo, Japan) was utilized to evaluate cell proliferation according to the manufacturer’s instructions. Briefly, cells were seeded onto a 96-well plate (Corning Incorporated) in triplicate at a density of 1 × 10⁴ cells/well, and cell proliferation was subsequently evaluated daily for 3 days. To assess cell number, the absorbance at 450 nm was measured in each well using a Model 680 Microplate Reader (Bio-Rad, Hercules, CA, USA), and the mean absorbance of the samples at each incubation time minus the absorbance at time 0 was calculated. The mean absorbance of the 3 replicates in each sample (PSP, n = 4; BHDS, n = 4) was recorded as the representative value.
Wound cell migration assay
A real-time migration assay was conducted using the IncuCyte ZOOM system (Sartorius, Göttingen, Germany) in 96-well plates according to the manufacturer’s instructions. Briefly, cells were seeded in triplicate at a density of 1 × 10⁴ cells/well and scratch wounds were made using the IncuCyte WoundMaker (Sartorius) after cells reached 90% confluence. The plates were monitored every 3 h via live cell imaging and time-lapse images. Results were presented as wound confluence (%) (i.e., percentage of the wound area occupied by cells). The mean value of the 3 replicates in each sample (PSP, n = 3; BHDS, n = 3) was reported as the representative value.
Apoptosis assay by flowcytometry
Cell apoptosis was evaluated with flow cytometry using a fluorescein isothiocyanate (FITC)-conjugated Annexin V Apoptosis Detection Kit I (BD Biosciences) according to the manufacturer’s instructions (see details in Supplementary Information online).
Immunohistochemical staining of cleaved caspase-3
Lung tissues resected during surgery for SP were fixed in 10% buffered formalin and embedded in paraffin. After deparaffination of lung tissue specimens, antigen retrieval was sequentially conducted by autoclave in 10 mM Citrate buffer (pH 6.0) for 15 min at 105 ℃. Samples were incubated with anti-rabbit cleaved caspase-3 antibody (dilution 1:200; #9664, Cell Signaling Technology, Danvers, Massachusetts, USA) for 1 h at room temperature following incubation with Histofine Simple Stain MAX-PO (MULTI) (#424152; Nichirei, Tokyo, Japan) for 30 min at room temperature. Peroxidase staining was visualized with 3,3-diaminobenzidine and hematoxylin was used for counter staining. At least 300 PMCs were counted in each sample and the percentage of PMCs stained with anti-cleaved caspase-3 antibody was calculated in 3 unrelated samples per group.
Phalloidin immunofluorescence staining and confocal microscopy
Immunofluorescence phalloidin staining was performed as previously described11. In our study, PMCs were seeded in triplicate at a density of 3 × 10⁵ cells on a 35 mm glass-bottom dish and cultured in the complete medium until the cells became confluent. Immunofluorescence images were obtained using a Leica TCS SP5 II confocal microscope (Leica Biosystems, Wetzlar, Germany). Reproducibility was verified in 3 unrelated samples in each sample (PSP, n = 3; BHDS, n = 3).
Measurement of active guanosine triphosphate (GTP)-bound Ras homolog family member A (RhoA) and total RhoA
The levels of active GTP-bound RhoA (RhoA-GTP) and total RhoA were determined using the G-LISA RhoA Activation Assay Biochem Kit (Cytoskeleton Inc., Denver, CO, USA) and the Total RhoA ELISA Assay (Cytoskeleton Inc.), respectively, as done in previous research11. In our study, PMCs were seeded at a density of 3 × 10⁵ cells/well onto a collagen-coated 6-well plate (Corning Incorporated) and cultured until approximately 70% confluence was reached. The data were examined in terms of both RhoA-GTP and the RhoA-GTP/total RhoA ratio.
Western blot analysis of the E-cadherin-LKB1-AMPK signaling pathway
PMCs were seeded at a density of 3 × 10⁵ cells/well on a collagen-coated 6-well plate (Corning Incorporated). After cells reached 90% confluence, the complete medium was changed into serum-free medium, and cells were incubated for 24 h in the absence or presence of 1 mM 5-aminoimidazole-4-carboxamide ribonucleotide ([AICAR]; Wako Pure Chemical Ind. Ltd., Osaka, Japan). Details are provided in Supplementary Information. Supplementary Table S5 online shows the list of antibodies used for Western blot analysis.
Statistical analysis
Results are expressed as the mean ± SEM unless specified otherwise. Statistical differences between BHDS-PMCs and PSP-PMCs were analyzed using unpaired t-tests. A p value < 0.05 was considered significant. Statistical analyses were conducted using GraphPad Prsim 7 (GraphPad Software, La Jolla, CA, USA).